The Lipid Silhouette: A Visual Snapshot of Cardiovascular Risk in the Liposcale Report
Visualizing cardiovascular risk in a single image
As science advances, the amount of data generated to assess cardiovascular risk (CVR) continues to grow, including the composition, size, and number of lipoprotein subclasses. To make this wealth of information useful for rapid clinical decision-making, it is essential to have tools for visualization and interpretative summarization.
The Liposcale Test not only provides advanced molecular profiling through Nuclear Magnetic Resonance (NMR), but also synthesizes these complex data into an intuitive graphical tool: the Lipid Silhouette.
The Lipid Silhouette is a graphical model that enables a fast and comprehensive evaluation of a patient’s lipid metabolism, going beyond traditional parameters.
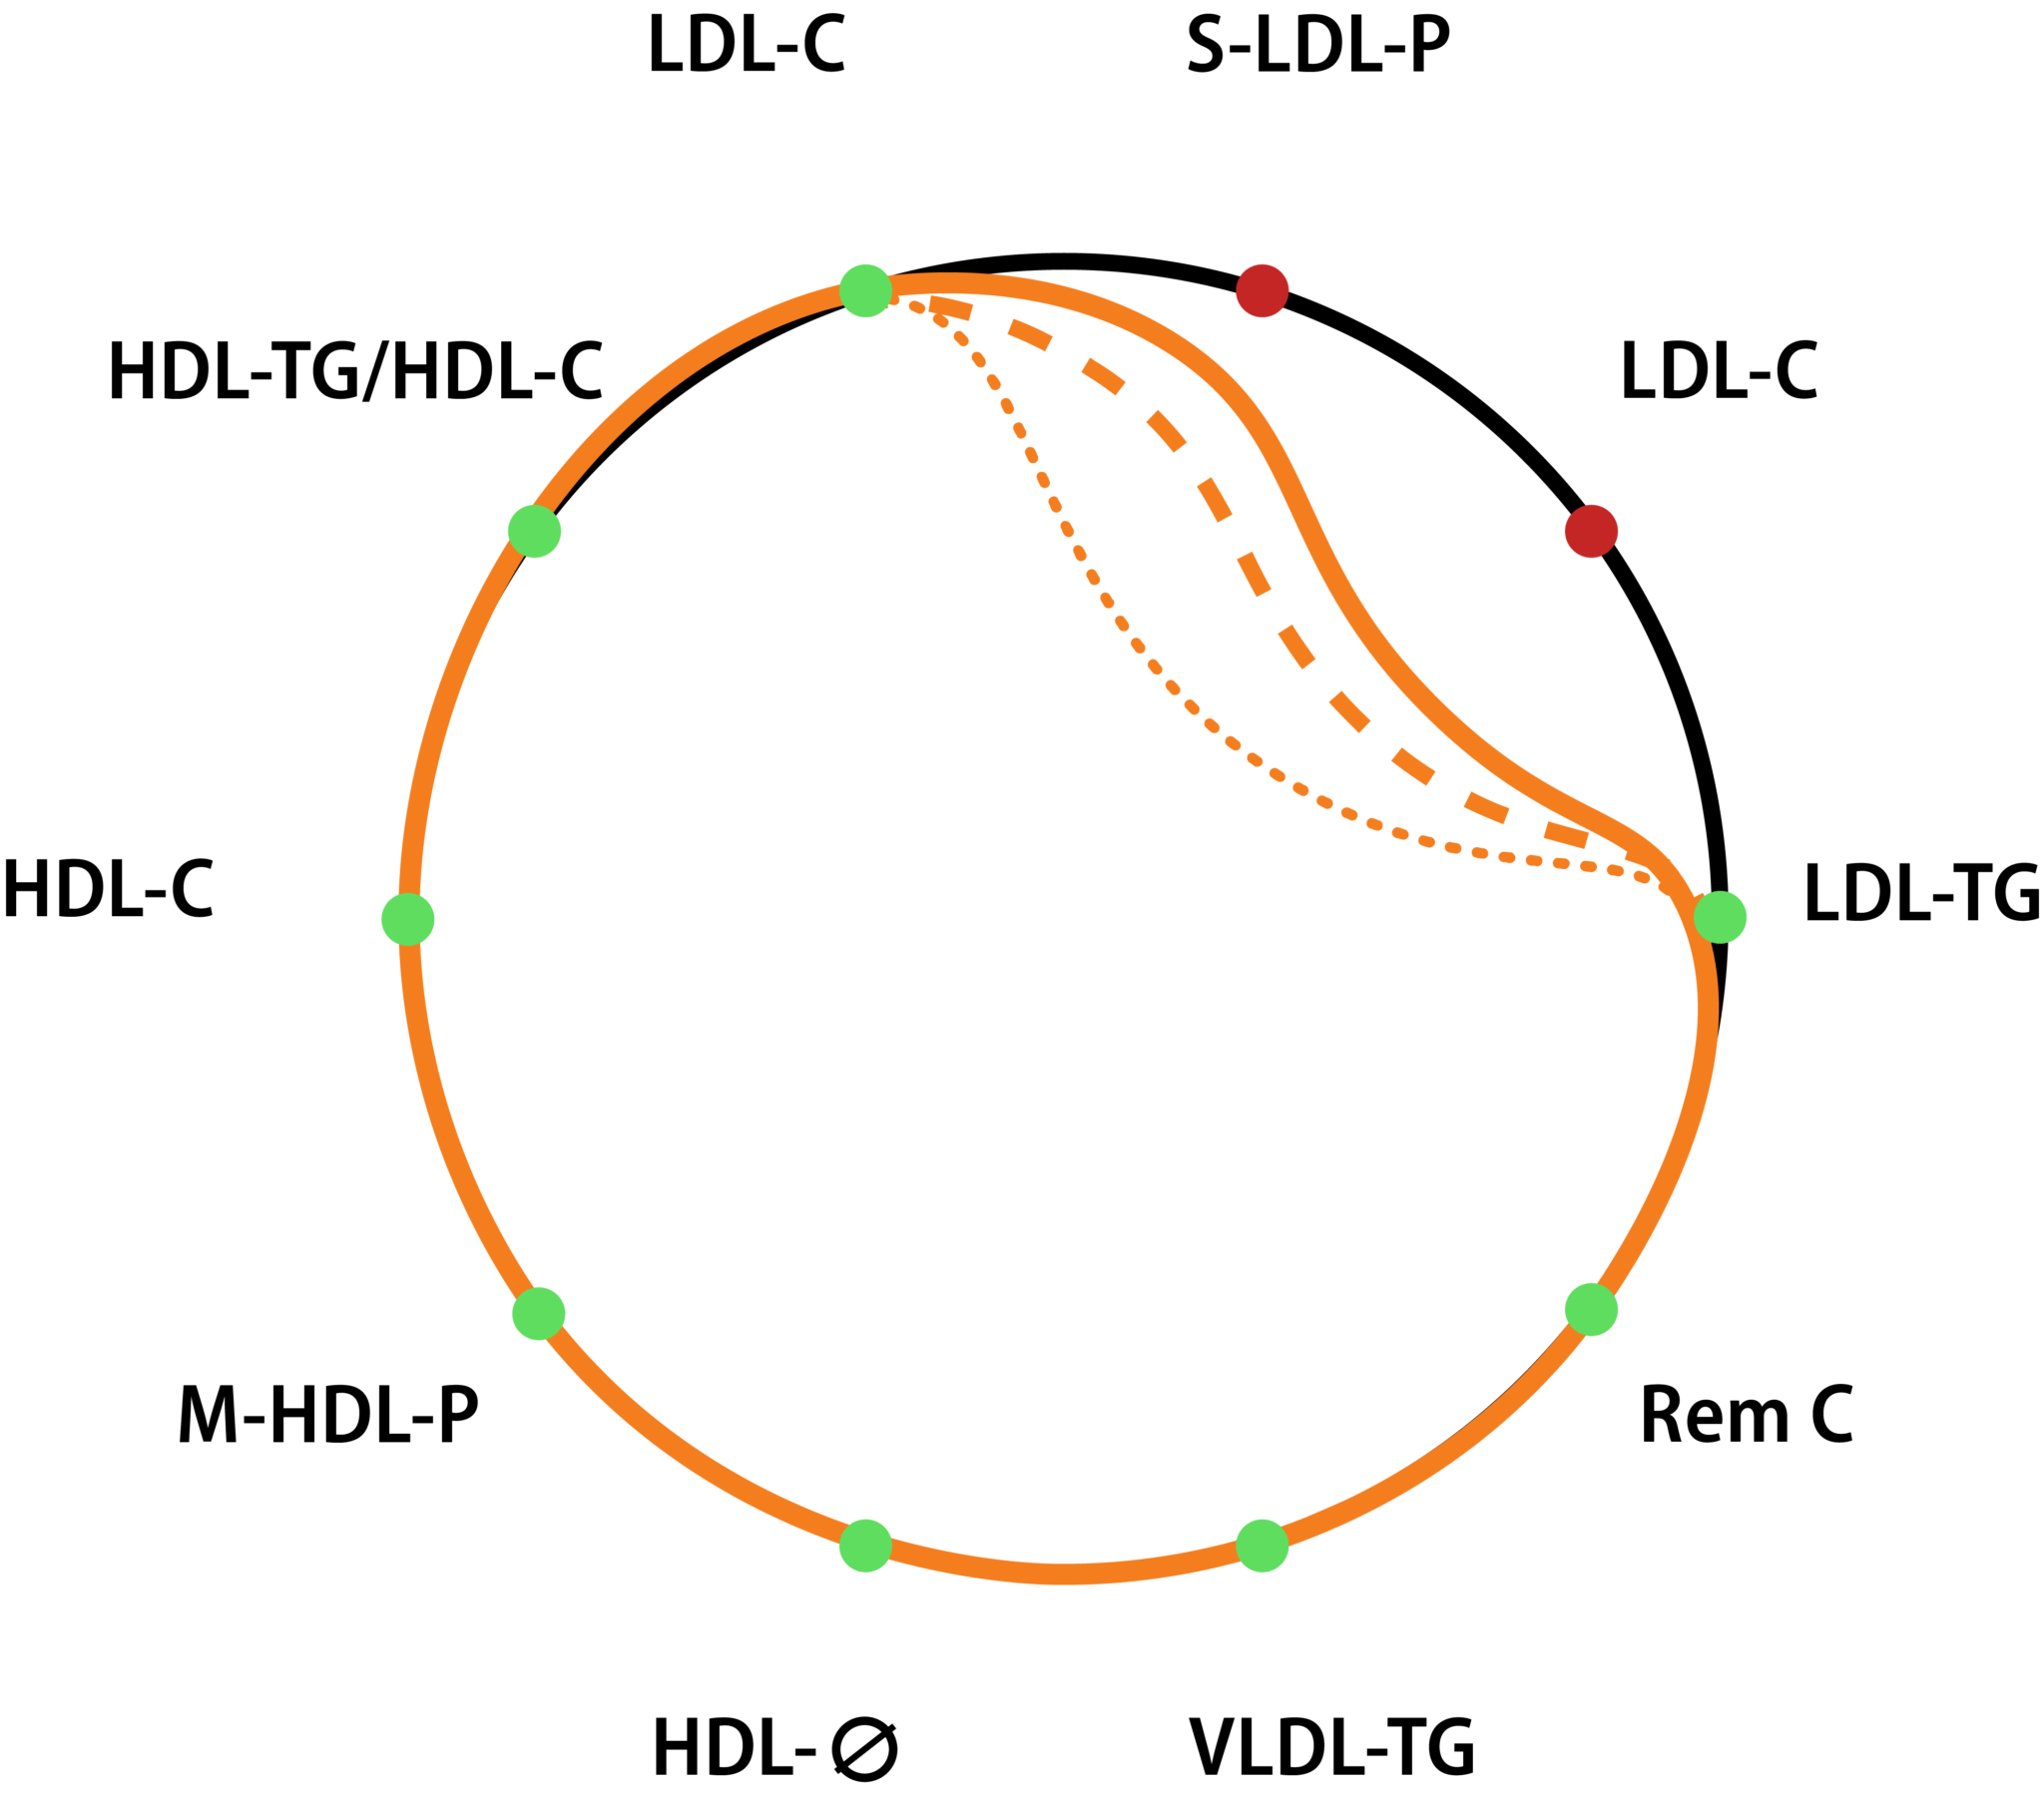
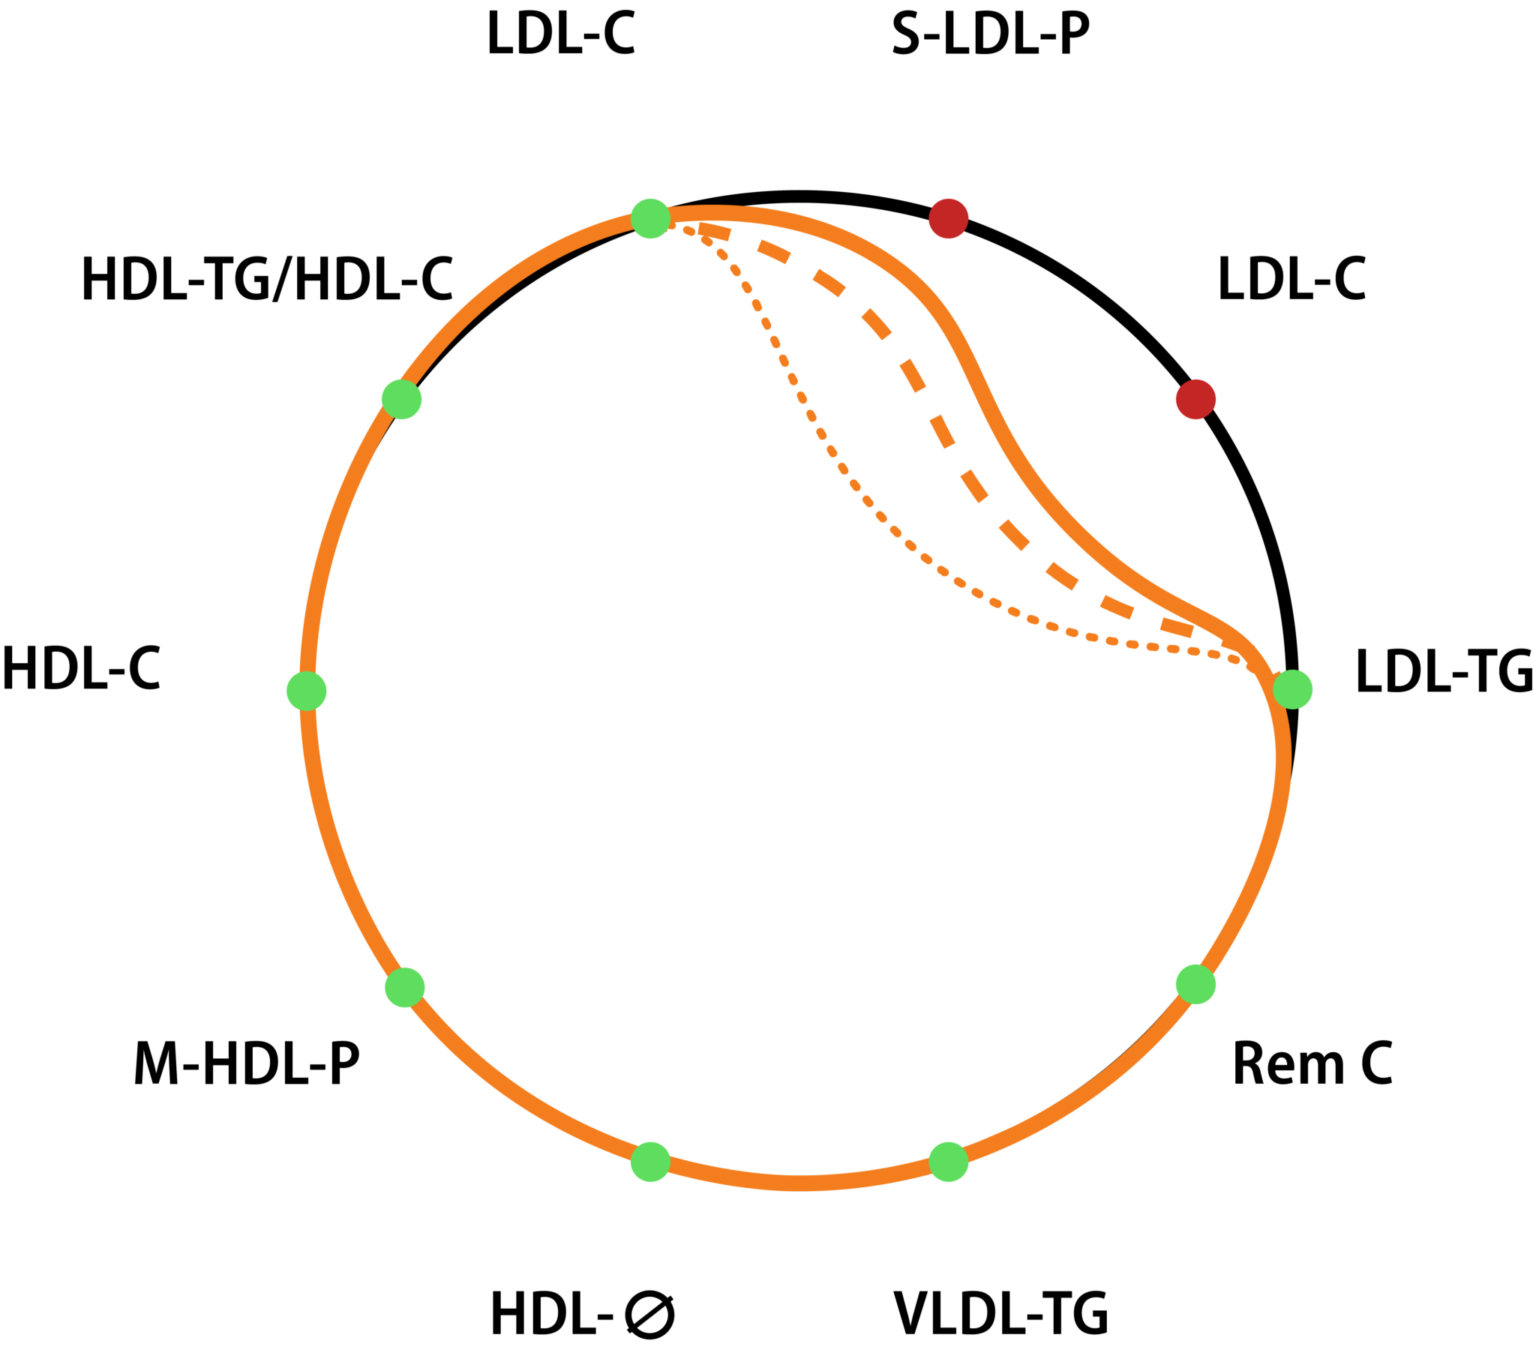
It compares the patient’s individual profile (orange curve) with values from a reference population (black circle), generated from a database of more than 6,000 individuals.
As science advances, the amount of data generated to assess cardiovascular risk (CVR) continues to grow, including the composition, size, and number of lipoprotein subclasses. To make this wealth of information useful for rapid clinical decision-making, it is essential to have tools for visualization and interpretative summarization.
The Liposcale Test not only provides advanced molecular profiling through Nuclear Magnetic Resonance (NMR), but also synthesizes these complex data into an intuitive graphical tool: the Lipid Silhouette.
The Lipid Silhouette is a graphical model that enables a fast and comprehensive evaluation of a patient’s lipid metabolism, going beyond traditional parameters.
It compares the patient’s individual profile (orange curve) with values from a reference population (black circle), generated from a database of more than 6,000 individuals.
How to visually interpret the Lipid Silhouette?
The shape of the orange contour reflects the patient’s metabolic status compared to the general population.
Inward narrowing: indicates alteration of the parameter and a greater contribution to cardiovascular risk.
Matching or exceeding the black circle: suggests values within the normal range or lower risk.
The degree of narrowing is proportional to the magnitude of the alteration.
The 10 key variables integrated into the Silhouette
This contour synthesizes information from 10 variables associated with cardiovascular risk.
Advanced lipid risk
Includes parameters directly related to atherogenicity:
LDL cholesterol (LDL-C)
Number of small LDL particles (S-LDL-P)
Triglycerides in LDL (LDL-TG)
Triglycerides in VLDL (VLDL-TG)
Remnant cholesterol (Rem-C)
Protective factors (inverse risk)
Variables associated with cardiovascular protection:
HDL cholesterol (HDL-C)
Number of medium HDL particles (M-HDL-P)
Mean diameter of HDL particles (HDL-Ø)
Mean diameter of LDL particles (LDL-Ø)
A precision medicine tool
The Lipid Silhouette integrates into a single image:
Advanced lipid profile (LDL-P, Rem-C, HDL-C)
Particle size and number
This makes it a precision medicine tool, facilitating: