A recent work published by Mireia Uribe-Herranz¹⁺², Aina Oliver-Caldés¹⁺³, Neus Martínez-Micaelo⁴, Marta Español-Rego², Maria Val-Casals¹⁺⁵, Roberto Martínez-Soler¹, Elisa Rubio-Garcia⁶⁺⁷⁺⁸⁺⁹, Valeria Brunello¹, Erik Z. Mihelic¹, Nela Klein-González¹⁺²⁺⁵, Daniel Benítez-Ribas², Núria Amigó⁴⁺¹⁰⁺¹¹, Andrea Vergara⁶⁺⁷⁺⁹⁺¹², Valentin Ortiz-Maldonado³, Luis Gerardo Rodríguez-Lobato¹⁺³, Julio Delgado³, Iñaki Ortiz de Landazuri¹⁺², Verónica González-Calle¹³, Valentín Cabañas¹⁴, Beatriz Martin-Antonio¹⁵, Lorena Pérez-Amill¹⁺⁵, Juan Luis Reguera-Ortega¹⁶, Paula Rodríguez-Otero¹⁷, Bruno Paiva¹⁷, Joaquín Martínez-López¹⁸, Maria-Victoria Mateos¹³, Mariona Pascal¹⁺², Álvaro Urbano-Ispizua¹⁺³, Europa Azucena González-Navarro², Carlos Fernández de Larrea¹⁺³, and Manel Juan¹⁺²⁺¹⁹⁺²⁰. has demonstrated that the gut microbiota and metabolite profiles influence the clinical response of patients with multiple myeloma treated with BCMA-directed CAR-T therapy (ARI0002h). Published in Blood Cancer Discovery (2025), the study integrates for the first time metagenomic, metabolomic, and immunophenotyping data to understand how the intestinal microbial environment affects the persistence and functionality of CAR-T cells.

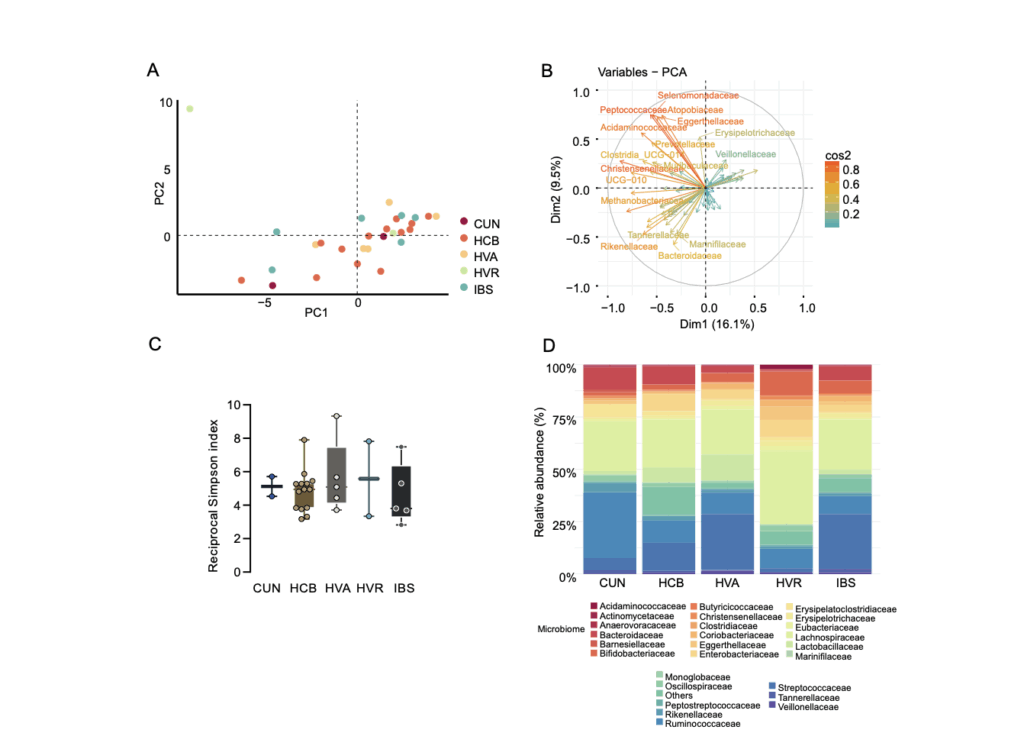
The study analyzed fecal and serum samples from 51 patients enrolled in the CARTBCMA-HCB-01 clinical trial, collected at different time points: before apheresis, before lymphodepletion, and after CAR-T infusion. The microbial composition was characterized by 16S rRNA sequencing, while the metabolomic profile was evaluated by nuclear magnetic resonance (NMR) and gas chromatography–mass spectrometry (GC–MS), allowing quantification of 35 fecal metabolites and serum short-chain fatty acids (SCFAs). In parallel, CAR-T cell persistence and clinical response were monitored at days 28, 100, and 180.
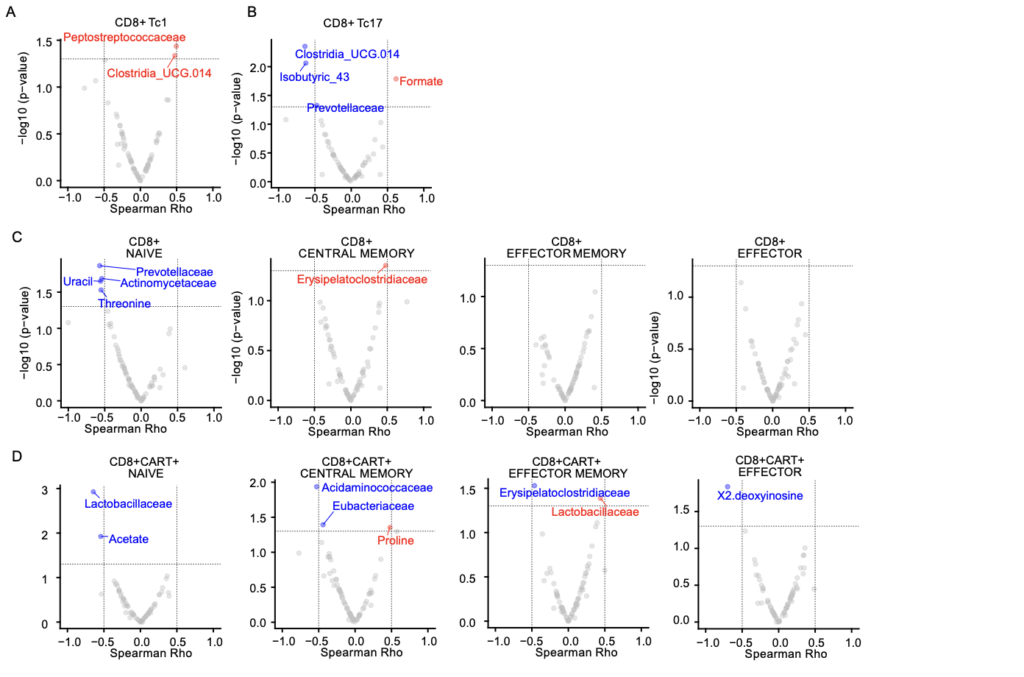
The authors found that higher stool succinate levels before infusion correlated with a greater proportion of CD4+ central memory T cells and enhanced CAR-T cell persistence after treatment. In cell culture, succinate supplementation during ex vivo expansion increased the respiratory capacity and metabolic profile linked to longer CAR-T cell lifespan, results that were also confirmed in murine models fed with fructooligosaccharide (FOS)-enriched diets.
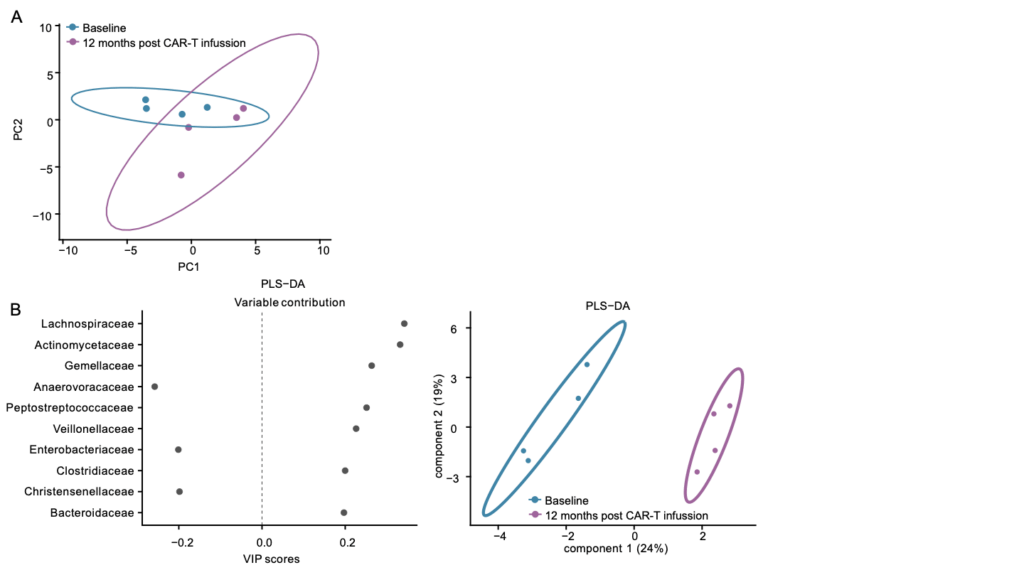
Additionally, integrative analyses revealed that certain bacterial families —such as Acidaminococcaceae, Barnesiellaceae, and Akkermansiaceae— were associated with complete responses, while Monoglobaceae and Erysipelotrichaceae were linked to suboptimal or absent responses.

By combining microbial, metabolomic, and immunological data, the researchers developed multimodal models for predicting clinical response, integrating information from bacterial composition, metabolic profiles, and cellular markers collected throughout the treatment.
Using machine learning and multivariate analysis techniques, they evaluated the relative contribution of each biological variable to patient outcomes, building models capable of predicting complete response with high accuracy (AUC ≈ 0.9) at both 100 and 180 days after CAR-T cell infusion.
These predictive models not only make it possible to identify patients more likely to benefit from the therapy, but also provide a valuable tool to personalize treatment strategies and clinical monitoring, incorporating the influence of the microbiome and host metabolism into the overall efficacy of immunotherapy.
Taken together, these results reinforce the idea that the gut microbiota is a key modulator of cellular immunotherapy and highlight the potential of a multi-omics approach to understand the complex interactions between metabolism, the microbiome, and antitumor immunity.
Looking ahead, the challenge will be to translate this knowledge into clinical practice by integrating microbial and metabolomic characterization into patient selection and monitoring protocols for CAR-T therapies.
Moreover, the possibility of modulating the microbiome through nutritional, prebiotic, or probiotic strategies opens a new field of research aimed at enhancing the efficacy and durability of CAR-T therapies in hematologic cancers, moving toward truly personalized immunotherapy based on the patient’s own biology.

Read the paper here.
Author Affiliations
August Pi i Sunyer Biomedical Research Institute (IDIBAPS), Barcelona, Spain
Department of Immunology, Centre de Diagnòstic Biomèdic (CDB), Hospital Clínic de Barcelona, Barcelona, Spain
Department of Hematology, Hospital Clínic de Barcelona, University of Barcelona, Barcelona, Spain
Biosfer Teslab, Reus, Spain
Gyala Therapeutics S.L., Barcelona, Spain
Department of Clinical Microbiology, CDB, Hospital Clínic de Barcelona, Barcelona, Spain
Barcelona Institute for Global Health (ISGlobal), Barcelona, Spain
Molecular Core Facility, CDB, Hospital Clínic de Barcelona, Barcelona, Spain
Department of Clinical Foundations, Faculty of Medicine and Health Sciences, University of Barcelona, Barcelona, Spain
Department of Basic Medical Sciences, Universitat Rovira i Virgili (URV), Institut d’Investigació Sanitària Pere Virgili (IISPV), Reus, Spain
Biomedical Research Networking Center in Diabetes and Associated Metabolic Disorders (CIBERDEM), Instituto de Salud Carlos III (ISCIII), Madrid, Spain
Biomedical Research Networking Center in Infectious Diseases (CIBERINFEC), Madrid, Spain
University Hospital of Salamanca, Biomedical Research Institute of Salamanca (IBSAL), Cancer Research Center (IBMCC–USAL, CSIC), Salamanca, Spain
Virgen de la Arrixaca University Hospital, IMIB-Arrixaca, University of Murcia, Murcia, Spain
Department of Advanced Therapy Medicinal Product Development, Instituto de Salud Carlos III, Madrid, Spain
Virgen del Rocío University Hospital, Institute of Biomedicine of Seville (IBIS/CSIC/CIBERONC), University of Seville, Seville, Spain
Clinica Universidad de Navarra, Center for Applied Medical Research (CIMA), IDISNA, CIBERONC, Pamplona, Spain
12 de Octubre University Hospital, Complutense University of Madrid, i+12, CNIO, Madrid, Spain
Clinical Immunology Unit, Hospital Sant Joan de Déu–Hospital Clínic de Barcelona, Barcelona, Spain
University of Barcelona, Barcelona, Spain